“Total fossil lockdown for a climate revolution”
June 26, 2020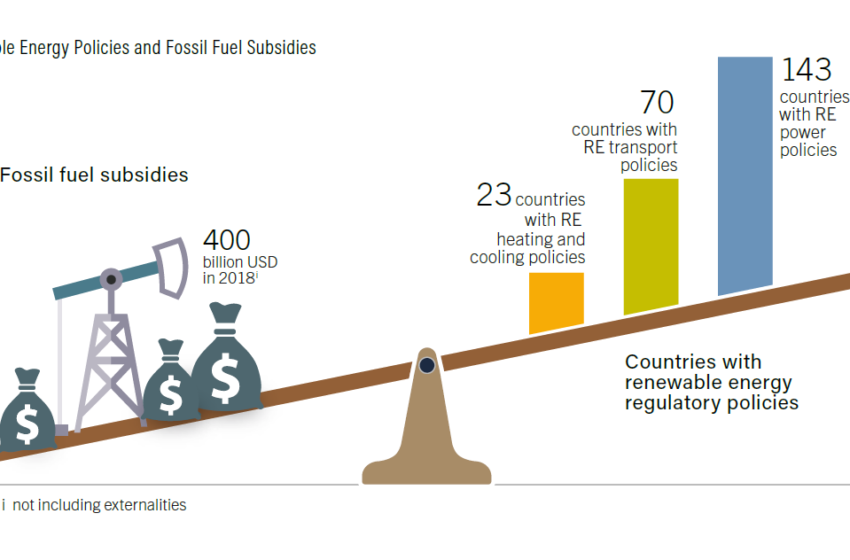
The new Renewables 2020 Global Status Report is calling for a “total fossil lockdown” to bring about a “climate revolution”. It also includes a warning: “Progress in the power sector is only a small part of the picture and it is eaten up as the world´s energy hunger continues to increase,” Rana Adib, REN21’s Executive Director, is quoted as saying in the accompanying press release posted on 16 June. The GSR, published by REN21 on an annual basis, has grown into one of the most trusted sources for data on the global energy market transformation. It is also probably the only report that is co-authored by over 350 experts.
About what exactly is the GSR 2020 sounding the alarm?
- Total final energy demand continues to rise; between 2013 and 2018, it grew by 1.4 % annually.
- In 2019, CO2 emissions from energy production and consumption remained at previous levels, which means the world is not on track to limit global warming to 2 °C.
- The proportion of renewables meeting total final energy demand increased only slightly over a period of six years (from 9.6 % in 2013 to 11 % in 2018).
- By the end of 2019, no more than 49 countries had set renewable heating and cooling targets, compared to 166 countries that have set goals for renewable electricity.
- The barriers to growth in the heating, cooling and transport sectors are almost the same they were a decade ago.
Hence, Adib called on governments around the world to “radically change the market conditions and rules and demonstrate the same leadership as during the Covid-19 pandemic.”
Facts and figures are presented in the report in a rather condensed form, although the original sources for all data are cited at the end of the document. Many notes at the end of the report also provide links for further reading on the subject. The charts included in the GSR 2020 are available as image files and can be downloaded from https://www.ren21.net/reports/global-status-report/. REN21’s website also offers a 36-page summary of key findings. Within only one week after the launch, the GSR 2020 has received an enormous amount of media coverage, prompting 240+ articles and garnering 1,000+ mentions on social media, according to REN21’s Secretariat. On average, GSR reports are downloaded about 50,000 times a year.
More clean electricity used for heating
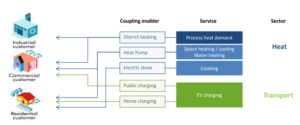
This year, the report took a closer look at two end-use sectors, buildings and industry. It also contains two new charts that illustrate how much of the demand in each sector is met by renewables.
Buildings: Fossil fuels are still the main choice for heating and cooling buildings. In 2018, newer sources of renewable energy met about 10.1 % of heating and cooling demand in housing stock, up from 8 % in 2010. Much of the increase was the result of using clean electricity or solar thermal, while the share of modern bioenergy systems remained unchanged. Using clean electricity to heat buildings is a rapidly growing market, which expanded by 5.3 % in 2018 and met 3 % of the world’s demand for heating and cooling in buildings. This was twice the share of solar heat, which provided 1.5 % of the total (see the following chart).

Industry: Clean energy met just about 14.5 % of demand from industrial and agricultural businesses in 2017. Most of the energy was supplied as low-temperature heat (below 100 °C) by bioenergy systems to pulp and paper businesses (black liquor) and other companies producing biowaste and bio-residue on site. Solar thermal and geothermal heat contributed only 0.1 % to the total that year. Clean power was used both directly for electrical equipment and to meet the heat requirements of some industrial processes, for example, industrial heat pumps (up to around 160 °C) and electric arc furnaces.

The GSR’s main chapter, called Market and Policy Trends, includes a detailed assessment of all relevant renewable technologies, including solar heating and cooling (pp. 124 to 130). The capacity additions shown in the table below indicate opposing trends. Whereas in the last two years, the PV and wind power industry grew by 17 % and 15 % respectively, solar heating and cooling declined by 11 %, mainly because of a drop in demand from China and several other key markets, such as Germany, Italy, Austria and France.
|
Capacity added in 2017 |
Capacity added in 2018 |
Capacity added in 2019 |
Growth 2017-2019 |
Top five countries based on newly installed capacity in 2019 |
|
|
Solar heating and cooling |
35 GW |
33.3 GW |
31.3 GW |
-11 % |
China, Turkey, India, Brazil, United States |
|
PV |
98 GW |
100 GW |
115 GW |
+17 % |
China, United States, India, Japan, Vietnam |
|
Wind |
52 GW |
51 GW |
60 GW |
+15 % |
China, United States, United Kingdom, India, Spain |
|
CSP |
100 MW |
550 MW |
600 MW |
+500 % |
Israel, China, South Africa, Kuwait, France |
|
Geothermal |
0.7 GW |
0.5 GW |
0.7 GW |
0 % |
Turkey, Indonesia, Kenya, Costa Rica, Japan |
|
Hydropower |
19 GW |
20 GW |
15.6 GW |
-18 % |
Brazil, China, Laos, Bhutan, Tajikistan |
Data taken from Chapter 3, Market and Industry Trends 2019, of GSR 2020. The large fluctuations in the concentrating solar power (CSP) market are caused by long development times and big projects.
The GSR 2020 report covers the solar heating and cooling industry on the following pages:
- Executive summary on solar heating and cooling (p. 22)
- Solar heating and cooling market and industry (pp. 124 to 130)
- Table R18. Solar water heating collectors and total capacity at the end of 2018, as well as newly installed capacity in top 20 countries in 2019 (p. 239)
- Policy landscape: Heating and cooling (pp. 60 to 62)
- Table R9. Renewable heating and cooling policies in 2019 (pp. 223 to 224)
You can download the Renewable 2020 Global Status Report and all other information material from http://www.ren21.net/gsr