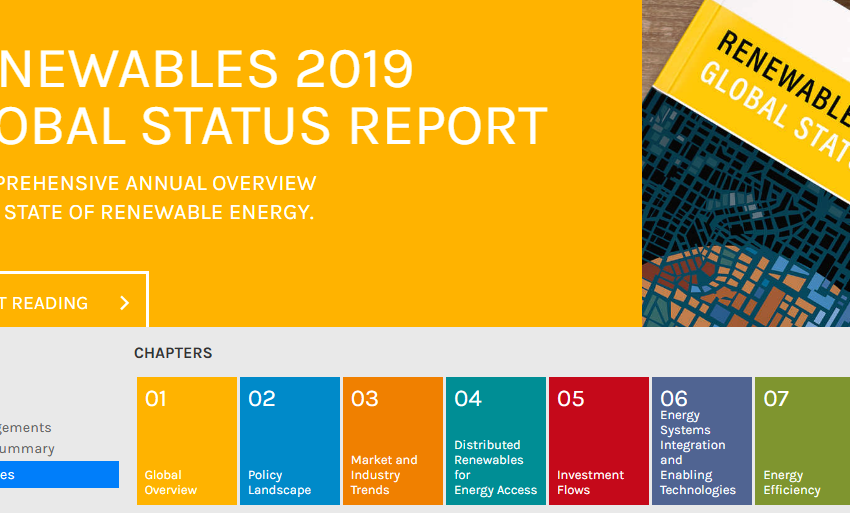
Over the last 15 years, the annual Renewable Global Status Report has grown into one of the most respected sources of information about the energy market transformation worldwide. It contains data and explanations provided by the REN21 network, which has more than 900 contributors who cover different aspects of renewable energies around the globe. They write about not only policy but also technology, markets, energy systems integration, investments and local projects. Within a week after its publication on 17 June, the 2019 report has already been discussed at events on four continents: the Dialogue on Renewable Energy and the Energy Transformation in Sao Paulo, Brazil; the Asia Clean Energy Forum in Manila, Philippines; the RES4Med conference Overcoming Africa’s Energy Access Gap: Strategic Priorities for Scaling up Renewables in Addis Ababa, Ethiopia; and the EU Sustainable Energy Week in Brussels, Belgium.
The report found that there was still a huge gap between sectors, especially when looking at efforts to decarbonise economies. “Renewables supply more than 26 % of global electricity. However, they provide only 10 % of the energy used for heating and cooling and just over 3 % for transport,” stated the REN21 press release. The main reason for that imbalance, according to the authors of the report, was “insufficient and unstable policy support” throughout the heating, cooling and transport sectors.
Rana Adib, Executive Secretary of REN21, pointed out another crucial issue that, if solved, could fast-track the transformation: “A big breakthrough could occur if countries cut their fossil fuel subsidies.” In 2017, fossil fuel companies received a total of USD 300 billion globally, an 11 % increase compared to 2016, according to the press release.
| |
Capacity added in 2018
|
Capacity added in 2017
|
Top five countries based on 2018 capacity
|
|
Solar heating and cooling
|
33.3 GW
|
35 GW
|
China, Turkey, India, Brazil, United States
|
|
PV
|
100 GW
|
98 GW
|
China, India*/United States, Japan, Australia
|
|
Wind
|
51 GW
|
52 GW
|
China, United States, Germany, India, Brazil
|
|
CSP
|
550 MW
|
100 MW
|
China/Morocco, South Africa, Saudi Arabia
|
|
Geothermal
|
0.5 GW
|
0.7 GW
|
Turkey, Indonesia, United States, Iceland, New Zealand
|
|
Hydropower
|
20 GW
|
19 GW
|
China, Brazil, Pakistan, Turkey, Angola
|
Data taken from Chapter 3, Market and Industry Trends 2018, of GSR 2019.
*Solar PV data for India is highly uncertain
Recommended solar heating and cooling chapters and sections:
- Executive summary on solar heating and cooling (p. 23)
- Solar heating and cooling market and industry (pp. 110 to 117)
- Table R19. Solar water heating collectors and total capacity at the end of 2017, as well as newly installed capacity in top 20 countries in 2018 (p. 221)
- Global overview: Heating and cooling (pp. 35 to 36)
- Policy landscape: Heating and cooling (pp. 51 to 53)
- Table R9. Renewable heating and cooling policies in 2018 (p. 104)


