Brazil: Chinese Technology Dominates Imports
January 26, 2015
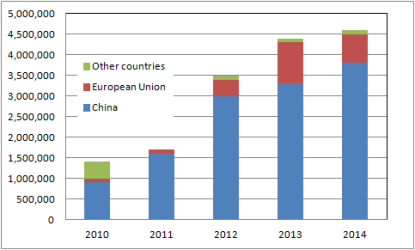
 Brazil´s solar thermal market grew by 20 % in 2012 and 2013, and therefore has been attracting an increasing number of international suppliers. Imports, mainly from China, have tripled since 2009. According to online portal AliceWeb, which includes the official foreign trade statistics for 2014, Brazil imported solar water heater equipment registered under code NCM 84191910 at a value of USD 4.6 million. The chart shows from where the equipment was imported.
The Chinese share in imports rose compared to 2013, but is still below the record level of 2011, when it reached approximately 90 % of the total imports. Meanwhile, the European Union (Italy being the most important country of origin here) gained some ground: Whereas it made up less than 10 % of the total import value until 2012, it had a share of 22 % in 2013 and 16 % in 2014.
Unfortunately, the statistics do not deliver information on the number of imported square meters or tanks. Industry stakeholders believe that NCM 84191910 includes most of the imported solar thermal equipment, which could be tubes, as well as collectors or tanks, because the country’s VAT exemption only applies to this one code – there are no separate HS codes for solar collectors or tanks. China accounted for 82 % of the total import value of USD 4.6 million, followed by the European Union with about 16 % of all imports (see the following table).
|
|
Import value in 2014 (USD) |
Share in total import value in 2014 |
|
China |
3,816,179 |
82.0 % |
|
Italy |
411,768 |
8.8 % |
|
Portugal |
138,754 |
3.0 % |
|
France |
59,554 |
1.3 % |
|
Spain |
45,582 |
1.0 % |
|
UK |
45,114 |
1.0 % |
|
USA |
34,879 |
0.7 % |
|
Germany |
33,578 |
0.7 % |
|
Others |
67,480 |
0.5 % |
|
Total |
4,652,888 |
100 % |


