
IEA SHC: Market Report Aggregates 56 Country Statistics
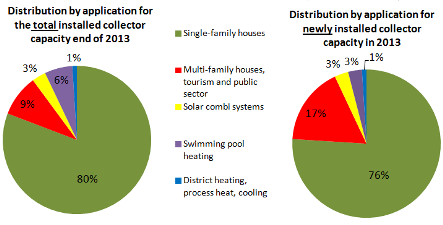
It is the most comprehensive publication on the global solar water heating market: the annual study Solar Heat Worldwide. On behalf of the IEA Solar Heating and Cooling Programme (SHC), Austrian research institute AEE INTEC has gathered data on 2013 market development from 56 countries worldwide – covering 95 % of the world market. The institute has asked national stakeholders for newly installed capacity, type of technology and application. Accumulating such detailed information at global level gives a comprehensive overview of the world market for solar heating and cooling. According to an extrapolation of the missing 5 %, installers set up a total capacity of 55 GWth – or 78.6 million m2 of glazed and unglazed solar collectors – in these 56 countries. The pie charts show the growing importance of large domestic hot water applications in multi-family buildings as well as the tourism and public sector (see page 36/37 of the attached study). In 2013, 17 % of the newly installed collector capacity was installed in this segment (right), whereas it only accounts for 9 % of the total installed collector capacity in operation (left). The number of unglazed solar collectors for private swimming pools has diminished worldwide. Although they still make up 6 % of the total capacity, they only contributed 3 % to the new collector capacity in 2013. With 577 MWth (0.8 million m2) of newly installed capacity in 2013, non-residential applications, such as district heating, process heat and cooling, are still a real niche market.
Source: Solar Heat Worldwide 2013 edition 2015
Dominating applications differ a lot from region to region: In Australia and North America, the statistics mainly show swimming pool systems, whereas in the new emerging MENA region, the highest share is reached by domestic hot water applications. On this point, the study’s authors make clear that, for example, multi-family buildings in Israel or China have mostly been equipped with thermosiphon systems connected to each flat, whereas in many European countries, large domestic pumped hot water systems supply buildings from a central location. It is only in Europe that solar combi systems have a significant share. Not including China, Asia has a strong non-residential segment.
 Distribution of solar thermal systems by application for newly installed water collector capacity, broken down by economic region in 2013. Sub-Saharan Africa: Mauritius, Mozambique, South Africa and Zimbabwe; Asia excluding China: India, Japan, South Korea, Taiwan and Thailand; Latin America: Brazil, Chile and Mexico; Europe: EU 28, Albania, Macedonia, Norway, Russia, Switzerland and Turkey; MENA region: Israel, Jordan, Lebanon, Morocco, Palestinian Territories, Tunisia (see page 37)
 Source: Solar Heat Worldwide 2013 edition 2015
In chapter Market development of glazed water collectors between 2000 and 2013, the authors point out the decline in growth rates from year to year since 2008. After the boom year’s global growth of 35 %, annual growth rates dropped to 7 % in 2012 and even to 2 % in 2013 (see page 25). The Rest of the World (RoW), including all economic regions other than China and Europe, experienced strong double-digit growth during 2008 and 2012, but the slump of the Indian market in 2013 dragged down the solar thermal capacity in RoW for the first time since 2004, decreasing it by 2 %. The Indian market volume was far below expectations two years ago because the Indian government had delayed the repayment of subsidies which were pre-financed by the Channel Partners and which reduced system prices by 30 % when programme partners sold them to clients.
|
Unglazed collectors |
Flat plate collectors |
Vacuum tube collectors |
|
|
2013 |
2.3 % |
86.2 % |
11.3 % |
|
2010 |
3.1 % |
87.2 % |
9.7 % |
Share of collector type in newly installed area in Europe (E28) between 2010 and 2013
Source: Solar Heat Worldwide, 2015 edition
Solar thermal capacity newly installed around the globe in 2013 was dominated by evacuated tube collector technology with 79.4 %, followed by 17.4 % of flat plate collectors and 3.1 % of unglazed water collectors. In Europe, the situation was vice versa: Flat plate collectors dominated with over 85 % and vacuum tubes achieved a share of around 10 %. Between 2010 and 2013, the share of vacuum tube collectors in Europe increased slightly because of more imports of vacuum tube technology in Poland.
More information: