Switzerland: Process Heat Collector Performance Testing
April 1, 2014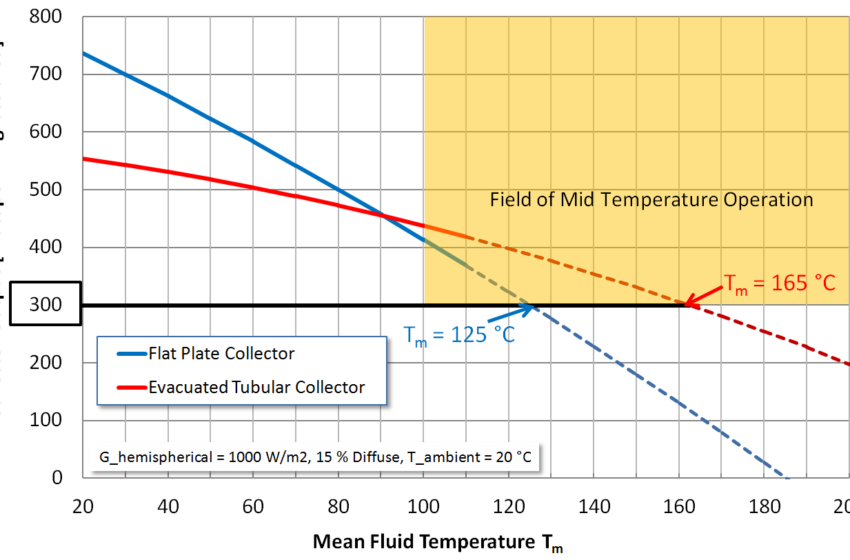
 Process heat collectors in the range of 100 to 250 °C represent a rather new type of technology, and test institutes are facing some challenges when trying to test these collectors. Solarthermalworld.org spoke with Dr Elimar Frank, Research Director at the Swiss Institute for Solar Technology, SPF, in Rapperswil. Frank is also Subtask Leader for Process Heat Collector Development and Process Heat Collector Testing in Task 49 of the IEA Solar Heating and Cooling Programme. The chart shows the efficiency curves of different collector types.
Charts: SPF
Solarthermalworld.org: Process heat collectors cover a broad temperature range. How do you distinguish between the different collector types in Task 49?
Frank: We differentiate between collectors according to their design temperature. For example, we talk about mid-temperature collectors in the temperature range from 100 to 250 °C. In Task 49, we developed the following definition: A collector fulfils the requirements for the mid-temperature range if it exceeds 300 W per m2 of gross collector area above 100 °C when applying standard conditions – 1,000 W/m2 of irradiance, a 15 % diffuse fraction and 20 °C of ambient temperature. In the chart above, it is the blue line which shows a flat plate collector reaching 300 W/m2 at a mean fluid temperature of 125 °C. The red line shows the efficiency curve of a vacuum tube collector, which still achieves the minimal collector output of 300 W/m2 at around 165 °C of mean fluid temperature. Hence, we see that both types can be called mid-temperature collectors if applying the criteria of 300 W/m2 under these reference conditions.
Solarthermalworld.org: Why are the efficiency lines dotted?
Frank: So far, almost all collector tests have been carried out up to 120 °C, because that is the temperature manufacturers have set for normal collectors. We are aware that extrapolating the temperature curve beyond 120 °C creates a source of uncertainty, which is why the SPF and also some other test institutes have decided that we want to be able to test up to 200 °C, which is not so trivial. For example, if you test with water, as we do at the SPF with our newly developed test rig, pressure will increase significantly at 200 °C to about 20 bar. We had to build completely new test stands, because the existing ones were not suitable. The best part of the story is that we are now able to test collectors up to 200 °C and test reports are already available for a number of collectors. The yellow curve in the following chart shows the results from thermal performance measurements according to the current standard for the parabolic trough collector.

Solarthermalworld.org: What does the new yellow efficiency curve stand for?
Frank: The yellow curve shows the efficiency of a parabolic trough collector which was designed for the medium-temperature range. The collector has a non-evacuated receiver, and performance was measured outdoors in June and July 2013, with an irradiation of between 700 and 950 W/m2. We measured the efficiency up to 190 °C of mean fluid temperature, at which the line does no longer consist of dots. The minimum efficiency of 300 W/m2 of gross area would theoretically be achieved far beyond 200 °C. However, the collector would defocus when reaching a certain maximum temperature – otherwise, it would be damaged as it was not designed to cope with temperatures higher than, for example, 250 °C. At 100 °C, performance output for these special conditions (IAM = 1, 1000 W/m2, 15 % diffuse, 20 °C ambient temperature) is around 550 W/m2 and, therefore, about 30 % higher than for many flat plate and evacuated tube collectors.
Solarthermalworld.org: Does this mean that concentrating collectors also have a 30 % higher specific output per m2 than flat plate collectors?
Frank: What really matters with regard to a specific application at a given location is the annual collector field output in terms of kWh/year. It will require either a simulation, for example, including the load profile of the application or – much simpler – a gross heat gain calculation. This is important, because the conditions – irradiance, angle of incidence, ambient temperature, etc – change significantly throughout the days and throughout the year, something that cannot be easily evaluated by comparing efficiency curves of different collectors as shown above. However, these changes have a huge influence on collector performance. In Task 49, a tool called ScenoCalc is being developed further to do such gross heat gain calculations, also with different types of concentrating and tracked collectors. At the SPF, we are currently developing a tool called GainBuddy, which will allow us to do gross heat gain calculations for collector fields and not just for individual collectors. This tool will also consider measurements such as end losses and row shading.
Solarthermalworld.org: In most cases, process heat applications are complex projects when it comes to integration and demand profiles. The efficiency curve seems to be only one piece of the puzzle?
Frank: Yes, it definitely is. Efficiency curves only give you a narrow view under restricted conditions. Furthermore, I think the quality aspects of the system are as important as performance issues. It doesn’t help you if you have a rocket of a collector if it only last for two or three years. There is still a lot to be done in collector development to make the collectors safe and durable. During all the collector tests we did over the past years, we noticed that around three quarters of the collectors which are newly developed and tested for the first time fail at least one of the quality tests, even if they show high thermal performance.
More information:
http://www.spf.ch