India: Statistics to Determine Vacuum Tube Market Share
February 17, 2015
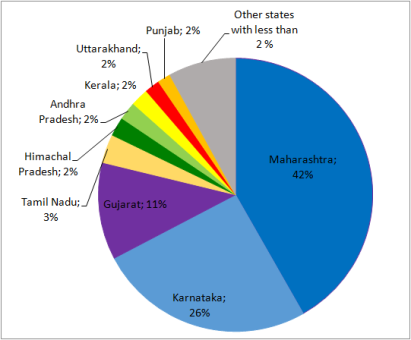
 Flat plate collectors – India’s dominant solar thermal technology about a decade ago – has lost a significant portion of its market share in recent years. Although the Ministry of New and Renewable Energy (MNRE), the Indian authority responsible for solar heating statistics, has never published an official figure for the market share of vacuum tube collectors in a given year, a June 2013 interview with former MNRE Director Veena Sinha revealed that the share of vacuum tubes in the residential sector was close to 60 % in Financial Year 2012-2013. The 2014 statistics of online portal Solarwhin still show just about the same percentage: Of the 607,751 m² of subsidised collector area in 2014, 61 % were vacuum tube collectors (369,292) and 39 % flat plate collectors (238,459 m²) – see also the attached PDF, which resulted from a query to the online Solarwhin database. The pie chart above shows the Indian states in which most of the collector area was installed in 2014.
Source: Solarwhin
Maharashtra and Karnataka accounted for almost two-thirds of the total newly installed collector area in 2014, a sign that there is still vast, untapped potential for solar thermal use in all other states. The Solarwhin statistics only show one part of the year because subsidies were discontinued in August 2014.
Another source for analysing the vacuum tube share in the nation’s solar thermal industry are the official import statistics of Legumex Impex, as not a single vacuum tube manufacturer has surfaced across the nation, meaning all vacuum tubes are imports. Website https://www.zauba.com offers the opportunity to search by HS code and by technology. The database provides monthly figures on either “evacuated solar tubes” or “solar vacuum tubes”. The following table shows the 2014 statistics for four different HS codes, all of them related to solar.
| HS Code |
84199010 |
84199090 |
84191920 |
70023900 |
| Technology |
Solar vacuum tubes |
Solar vacuum tubes |
Evacuated solar tubes |
Evacuated solar tubes |
| Number of pieces Jan 14 |
82,969 |
171,337 |
51,175 |
6,210 |
| Number of pieces Feb 14 |
75,538 |
169,370 |
29,050 |
26,055 |
| Number of pieces Mar 14 |
71,007 |
105,018 |
13,900 |
29,780 |
| Number of pieces Apr 14 |
90,567 |
128,747 |
12,405 |
26,080 |
| Number of pieces May 14 |
168,763 |
262,957 |
18,990 |
0 |
| Number of pieces June 14 |
114,772 |
82,740 |
31,881 |
0 |
| Number of pieces July 14 |
19,800 |
21,183 |
31,385 |
38,250 |
| Number of pieces Aug 14 |
54,298 |
65,266 |
42,620 |
0 |
| Number of pieces Sep 14 |
168,811 |
118,032 |
19,460 |
0 |
| Number of pieces Oct 14 |
233,677 |
193,735 |
0 |
41,662 |
| Number of pieces Nov 14 |
345,303 |
138,270 |
28,070 |
0 |
| Number of pieces Dec 14 |
568,665 |
87,437 |
77 |
11,600 |
| Total |
1,994,170 |
1,544,092 |
279,013 |
179,637 |
Statistics from https://www.zauba.com. You can enter the HS code and the technology on the starting page and use the link “Click here to view detailed analysis and trends of Import of solar vacuum tubes under a particular HS code” to view a diagram showing the number of pieces per month from the beginning of 2012 on.
Tubes imported through all four HS codes over the twelve-month period added up to 3,996,912. Most of them had a diameter of 47 mm and a length of 1,800 mm. The vacuum tube importers confirm that their tubes possess an active surface area of 0.133 m², which means that the total tube area amounted to 531,589 m². Factor 1.5 is used to translate vacuum tube area into gross collector area, so that the around 4 million imported tubes correspond to 797,384 m².
This figure needs to be compared to the newly installed collector area in 2014, a number calculated based on the achievement tables, which are regularly published by the Ministry of New and Renewable Energy (MNRE). According to the latest MNRE achievement table, the total installed collector area on 31 December 2014 was 8.63 million m². As per MNRE data at the beginning of January 2012, cumulative installation area added up 5 million m², which means that the newly installed collector area during the three-year period between 2012 and 2014 was 3.63 million m², of which 1.45 million were installed in 2012 and 1.05 million in 2013. This leaves 1.13 million m² for 2014, increasing the share of imported vacuum tubes to 70 % and making it a bit higher than the one shown in the Solarwhin market statistics.


