IEA SHC Study Solar Heat Worldwide: Global View on Country Statistics
June 6, 2016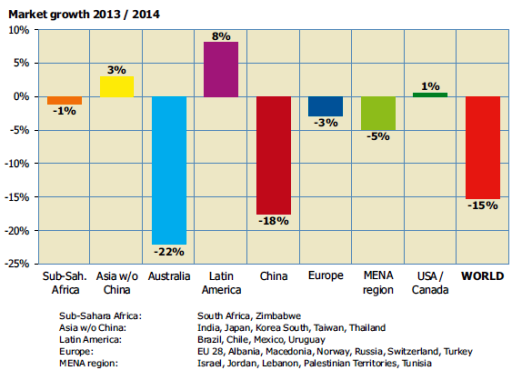 The recently launched report Solar Heat Worldwide 2016 offers a comprehensive overview of the global and national market development in the solar heating and cooling sector (see the attached document). On behalf of the IEA Solar Heating and Cooling Programme (SHC), Austrian research institute AEE INTEC gathered data on 2014 market changes from 61 countries worldwide, one more than last year (Lesotho). The authors of the report, Franz Mauthner, Werner Weiss und Monika Spörk-Dür, asked national stakeholders about the newly installed capacity in 2014, the type of technology used, the share of applications and, for the first time, the costs of solar thermal systems in their countries. The chart shows the market growth in newly installed capacity in 2013/2014 (glazed as well as unglazed collectors) worldwide and broken down by economic region. The report is the most comprehensive publication on the global solar heating and cooling industry and has been referenced by many international studies from IEA, REN21 and IRENA.
Charts: Solar Heat Worldwide 2016 (page 19).
There is no doubt that 2014 proved to be an extremely difficult year for the solar thermal industry, considering the strong 15 % decline in gross additions worldwide, a pattern which resurfaced in 2015, as the news piece Big Ups and Downs on Global Market shows. The principal reasons for the strong decline were shrinking markets in China (-18 %) and Europe (-3 %), which together accounted for 85.9 % of the newly installed total collector area. The only positive developments were reported from the other Asian countries (+3 %) and from Latin America (+8 %).
A surprising result came from the five MENA region countries: Israel, Jordan, Lebanon, Palestinian Territories and Tunisia. Israel – by far the largest market in the region – heavily contributed to the 5 % market decline in 2013/2014 (see the chart above) following a +8 % growth in 2012/2013. The newly installed collector area in 2013 had to be revised to an unusually high 452,800 m² based on new data delivered this year.
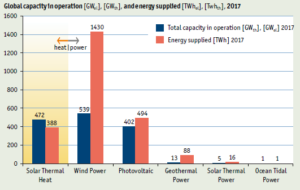
 Comparison of total capacity of and energy supplied by different renewable Technologies
 (Chart from Solar Heat Worldwide 2016 (Page 9)
Solar heating and cooling was still by far the solar technology with the largest total capacity in operation at the end of 2015 (435 GWth) compared to the other two, photovoltaics (227 GWel) and solar thermal power (5 GWel). The difference in energy supply between solar heat and solar electricity stems from the fact that kilowatt hours of heat are stored; As soon as the thermal storage is fully charged, the solar thermal circuit is switched off by the electronic control, which reduces the useful yield over the year. Photovoltaic systems, however, feed each kilowatt hour into the grid and use the grid as an “infinite storage”. Last year, the situation reversed in terms of added capacity. The 50 GWel of additional PV capacity in 2015 was, for the first time, higher than the ST addition of 39.6 GWth, after added PV capacity had been below the ST figure of 46.7 GWth in 2014.
It is possible to use the Solar Heat Worldwide study to provide a country ranking based on different parameters. The countries in the top spots are the same as in last year´s study; only the position has changed because Austria and Germany moved down one rank (see the following table).
|
Top Five in terms of…. Source: Solar Heat Worldwide 2016
|
|
|
Total capacity in operation (glazed collectors) at the end of 2014 |
China, Turkey, Germany, India and Brazil |
|
Specific total capacity in operation (glazed collectors) per inhabitant at the end of 2014 |
Cyprus, Israel, Austria, Barbados and Greece |
|
Newly installed capacity of glazed collectors in 2014 |
China, Turkey, India, Germany and Brazil
|
|
Newly installed capacity of unglazed collectors in 2014 |
USA, Brazil, Australia, Mexico and South Africa |
 Specific investment costs and levelized costs of solar thermal generated heat for small thermosiphon domestic hot water systems
 Source: Solar Heat Worldwide 2016 (page 45)
This year was also the first in which Solar Heat Worldwide included a chapter on system cost and levelised cost of heat of different system types in different countries. The chart above shows the specific cost of the investment (left y-axis and white rectangle to depict the cost range) and the levelised cost of solar thermal heat (right y-axis and grey bars with green diamonds) of small, domestic thermosiphon hot water systems in different countries. The calculations were based on a method greatly similar to the one used in Task 52 of the IEA SHC.
Websites of institutes and programmes mentioned in the article: