How planners use tools to assess solar potential in neighbourhoods
December 21, 2022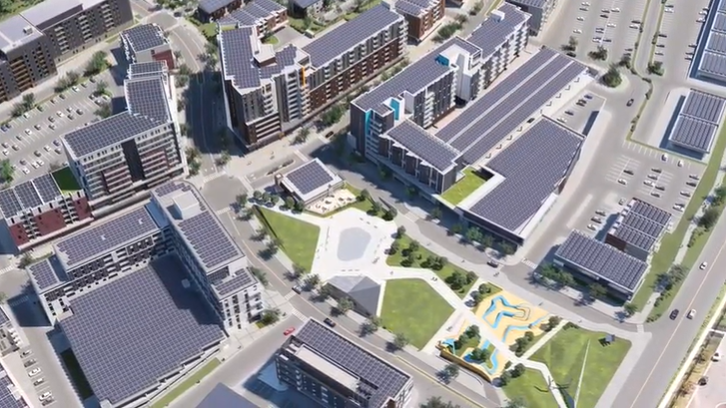
Digital tools play an increasingly important role in urban planning. Researchers from the IEA Solar Heating and Cooling Programme have cooperated on solar neighbourhood planning within Task 63 to describe how planners have used tools for irradiation assessment and a visual programming environment in selected new housing developments as well as building renovation projects. Altogether, 14 workflow stories have been put together in a report titled Identification of existing tools and workflows for solar neighborhood planning (available for download below). The photo shows the first integrated net zero energy community in Canada. Integrated means a neighbourhood with working, living and playground areas.
Photo taken from the West5 video online: https://youtu.be/aNqMyBpB1CI
“We are pleased that researchers from all the countries in Task 63 contributed at least one case study”, said Maria Wall, Associate Professor at Lund University’s Energy and Building Design division in Sweden and Chair of Task 63. The workflow stories describe projects in Australia, Canada, China, Denmark, France, Italy, Norway, Sweden and Switzerland. A workflow story is a description of how experts and/or companies have worked with advanced tools to assess the potential of active and passive solar technologies throughout the design process.
The Canadian workflow study describes the new neighbourhood West5 in London, Ontario – a building development project with 2,000 housing units and between 32,000 and 46,000 m2 of office and commercial space is planned as a net zero-energy neighbourhood. The first 200 residential homes and several commercial buildings are finished. All roof surfaces, many facades and roofing of parking lots are already being used for PV. “PV should play an important role in almost all sustainable community design but it should never be the singular focus of a design”, concluded Caroline Hachem-Vermette from the University of Calgary, who was one of the authors of the workflow study. Together with her colleagues, she has illustrated the extensive and challenging use of various specialised energy tools in this housing project in figure 1.
In the report, the authors described the interaction of the tools as follows: “The two tools SketchUp and Euclid allowed the virtual modelling of the neighbourhood. Using these 3D modelled buildings, EnergyPlus software was employed to input data such as internal loads and operation strategies of HVAC systems, weather data and specific simulation parameters necessary to compute the energy requirements and potential energy generation. Later in the development of the housing project, PVSyst was introduced to perform more detailed calculations regarding PV energy generation.”
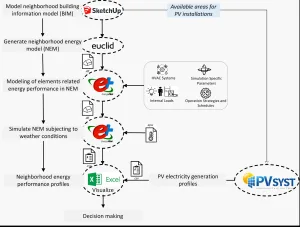
Figure 1: Conceptual design and energy analysis workflow for the new neighbourhood West4 in the Canadian town of London Source: Task 63
Usage of four tools to assess the PV potential for Melbourne
The workflow from Australia analyses the solar energy production potential for the city of Melbourne at various spatial resolutions. The approach was the following: PV potential was first simulated in selected neighbourhoods across the city. Via linear regression, the results were then extended to the whole city, taking into account the urban morphology. The key performance indicator was the share of annual electricity consumption of Melbourne that could be met by photovoltaic systems installed in facades, on roofs or in semi-transparent windows.
Mark Snow, independent Australian consultant and specialist in building-integrated PV, described the usage of tools for this assessment: “Seven urban form variables were calculated in Matlab by applying building height and window to wall ratios from an open-source building footprint dataset of the city of Melbourne and represented using ArcGIS PRO. Daysim/Radiance and PVWatts were then used to calculate the PV potential.” In the lessons learnt paragraph, Snow highlights the challenges in undertaking PV tool simulation at different urban scales whilst being mind¬ful of the level of detail required to support plan¬ning process decision-making.
Online cadaster with solar yields for particular buildings in Geneva
In Switzerland the workflow story looks particularly at the city of Geneva and is titled G2 Solaire. The main output of G2 Solaire is a web interface called Solar Cadaster of Greater Geneva, which displays the main solar maps and indicates solar yields to be harvested on every building in greater Geneva area with both applications: PV and solar thermal. https://apps.sitg-lab.ch/solaire/
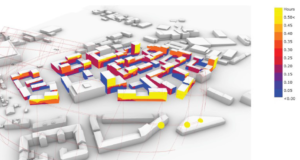
The solar online cadaster was already developed in 2010. It is based on LiDAR data and a 2.5D urban model (resolu¬tion of 0.5 m), hourly weather data from Meteonorm aver¬aged by month in order to reduce computing time and solar geometry on typical days of the month. In figure 3 the solar modelling process is structured into three main steps: pre-processing, image processing and post-processing.
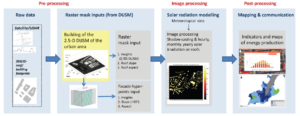
Figure 2: Workflow of the whole process of solar modelling on roofs and facades in the city of Geneva. Source: Task 63
Organisations mentioned in this news article:
IEA SHC Programme: https://www.iea-shc.org/
Task 63: Solar Neighborhood Planning: https://task63.iea-shc.org/