Denmark: Solvarmedata.dk Shows Yields of More Than 40 Solar District Heating Plants
September 3, 2014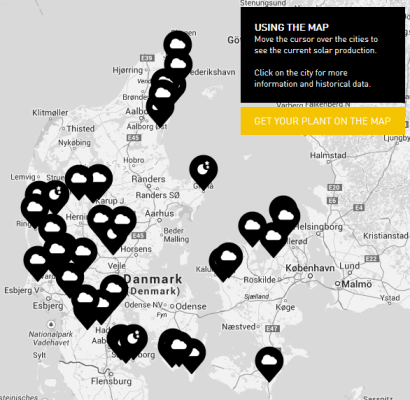
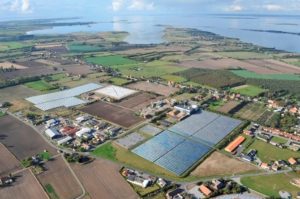
The interactive map on http://www.solvarmedata.dk, a website operated by agency Easynet, shows yield information entered by more than 40 solar district heating companies. The data also includes the irradiation figures and for most plants, even the hourly results of past years. The website was the brainchild of Per Kristensen, who came up with the idea when he was director of Braedstrup Fjernvarme. The screenshot shows the website’s first page.
“When we set up the solar district heating plant in Braedstrup in 2007, it was the first one to connect to a cogeneration plant, so many people were interested in its production data,” Kristensen, now Head of Kristensen Consulting, says. And so the idea of an interactive map was born.
The map “allows plant owners to compare their production data with the data of other plants in real time,” the consultant says. “And it also gives the government an overview of the solar activities of the district heating companies.” The website is financed by sponsors.
Production yield data on the Easynet servers is constantly updated via FTP or HTTP uploads by the plant operators. The information is stored on the server that provides the current and historical data to the website’s front-end.
Interactive map evaluates system performance of district heating plants
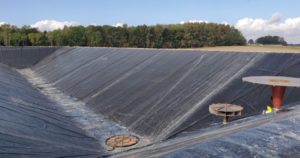
The solar heat production displayed on the interactive map indicates the gross energy supplied by the collector field. Losses of the storage tank, district heating network or other system components has not been subtracted yet.
The table below shows solrico’s evaluation of the system data from solvarmedata.dk. Only installations that were set up in 2012 or earlier were part of the evaluation process, in order to grant at least an entire year of observation, as data from the year of construction may be difficult to judge properly. The table does not show systems without a construction year, with later extension or with data missing.
| System |
Year of installation |
Collector area [m²] |
Specific annual yield [kWh/m²] |
Average efficiency |
Built by |
| Feldborg |
2012 |
4,000 |
427 |
42 % |
Arcon |
| Gørding |
2012 |
7,424 |
492 |
47 % |
Arcon |
| Gram |
2009 |
10,073 |
447 |
38 % |
Arcon |
| Grȃsten |
2012 |
19,024 |
460 |
42 % |
Arcon |
| Helsinge |
2012 |
4,733 |
496 |
44 % |
Arcon |
| Jaegerspris |
2010 |
13,405 |
423 |
32 % |
Sunmark |
| Ørnhøj-Grønbjerg |
2012 |
5,083 |
450 |
42 % |
Arcon |
| Saeby |
2011 |
11,866 |
472 |
42 % |
Sunmark |
| Skovlund |
2011 |
2,970 |
388 |
37 % |
Sunmark |
| Strandby |
2008 |
8,019 |
463 |
42 % |
Arcon |
| Svebølle-Viskinge |
2011 |
7,035 |
412 |
40 % |
Arcon |
| Sydfalster |
2011 |
12,094 |
492 |
45 % |
Arcon |
| Tistrup |
2010 |
5,409 |
443 |
45 % |
Arcon |
| Ulsted |
2006 |
5,012 |
455 |
39 % |
Arcon |
| Vejby |
2012 |
8,000 |
596 |
50 % |
Arcon |
| Vojens |
2012 |
17,500 |
420 |
38 % |
Sunmark |
| Average |
8,853 |
459 |
42 % |
Solar yield and efficiency of 16 district heating plans from online database solvarmedata.dk
The average annual solar yield in the table was calculated individually, system by system, starting in August after the construction year until the end of July 2014. The efficiency was calculated based on the indicated irradiation during the aforementioned period. The average specific solar yield was 459 kWh/m²a.
Jan Erik Nielsen from Danish consultancy PlanEnergi evaluated the data of 25 plants for 2013, and with between 400 and 500 kWh/m²*year for 21 out of the 25 plants, his calculations resulted in yields similar to the ones in the table. According to Nielsen’s presentation which he held in May 2014, the solar yields of district heating are 42 % higher than the ones of individual combi systems, whereas costs are 75 % lower.
More information:
Easynet web agency: http://www.easy-net.dk
Contact Per Kristensen: p.kristensen@outlook.com
PlanEnergi: http://www.planenergi.dk