Open data sets have great importance when analysing and optimising operation strategies for solar district heating plants
September 22, 2023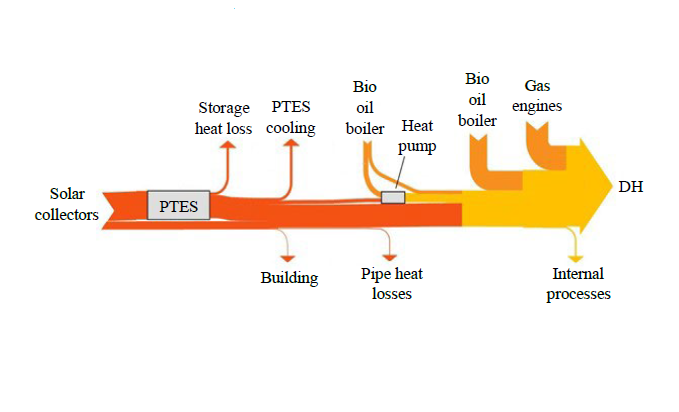
A complete annual data set of monitoring results for a solar district heating plant is an important prerequisite for meaningful simulations of such systems and for developing of monitoring algorithms. That is why the scientists working on IEA SHC Task 68 on Efficient Solar District Heating are committed to ensuring that quality controlled data sets are made publicly available. Two milestones have already been reached this year. In January and June, Task 68 scientists published papers describing comprehensive data sets and provided the data as CSV files with additional Python scripts for data processing and plot generation. One paper includes monitoring data for an Austrian solar district heating plant. The other describes operational data for a Danish seasonal heat storage installation.
Chart taken from paper “Dronninglund water pit thermal energy storage data set”
“Within Task 68 we review existing data sets and examine their quality and completeness”, said Viktor Unterberger, Manager of Task 68 and Senior Researcher at the Austrian BEST – Bioenergy and Sustainable Technologies Centre of Excellence. “Another important goal of our work is to introduce uniform naming schemes for the measured parameters so that users do not draw incorrect conclusions during post-processing.” Therefore, the two papers are of great importance for the further development of control strategies for solar district heating operation.
Such open data sets can also be important for building digital twins. The idea here is that engineers create a digital representation of a real-world solar district heating system. The digital twin helps the utility company to operate and optimize the physical system. In the first step, the digital twin is modelled and operated in parallel with the real SDH plant. In the second step, live data from the physical system is used in the digital model to provide simultaneous feedback to the system operator on how to optimally adapt the energy supply strategy to the demand in the heat network. Companies such as Gradyent from the Netherlands and Utilifeed from Denmark have already specialized in the development of digital twins for district heating operators.
But now we want to take a closer look at the two papers and their provided data sets (see following table).
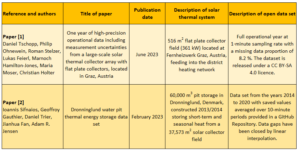
Open data sets described in two papers and made available as files for download.
Download links to data set of Paper [1]: https://zenodo.org/record/7741084 and https://gitlab.com/sunpeek/zenodo-fhw-arconsouth-dataset-2017
Download link to the data set of Paper [2]: https://github.com/PitStorages/DronninglundData
Source: Paper [1] and paper [2]
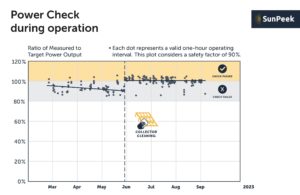
The data set of the Austrian district heating plant is currently used in the SunPeek Open Source Software tool to develop performance monitoring algorithms for large-scale solar thermal plants. The paper includes a section about shadowing. Figure 1 shows the effect of internal and external shadowing for the full measurement period 2017. The orange area shows that during summer months shadowing does not occur for most of the day.
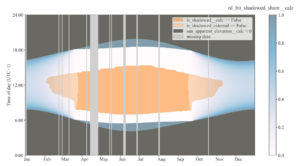
Figure 1: Array shadowing in 2017 at the solar district heating plant in Graz, Austria. Periods with no shadowing are in orange. Periods with no external shadowing are in bright orange. The colour bar on the right illustrates the proportion of internal (row-to-row) shadowing and the vertical grey lines show missing data. Source: Paper [1]
In its final section, the paper about Dronninglund water pit thermal energy storage illustrates possible ways to plot the available data. Figure 2, for example, presents the temperature in the upper layer (green) and in the bottom layer (blue) from 2014 to 2020. It is, for example, evident that in 2018 the storage facility had a higher average temperature than in the other years, as the temperature in the entire storage was higher during summer, including the lower layers of water (blue area). This is due to the increased solar radiation in that year compared to other years.

Figure 2: Storage temperature measured at different levels in the Dronninglund pit heat storage facility in Denmark between 2014 and 2021. Source: Paper [2]
Websites of organizations mentioned in this news article:
Task 68: https://task68.iea-shc.org/
IEA SHC Programme: https://www.iea-shc.org/
BEST Research: https://best-research.eu/
Utilifeed: https://www.utilifeed.com/
Gradyent: https://www.gradyent.ai/de
